Web App
QUAlibrate comes with a dedicated web app, enabling you to run any QualibrationNode and QualibrationGraph through an intuitive frontend.
The web app can be started by running the following command in the terminal:
qualibrate start
Node Execution Page
When accessing the URL on a web browser, you should be greeted by the Node Execution page:
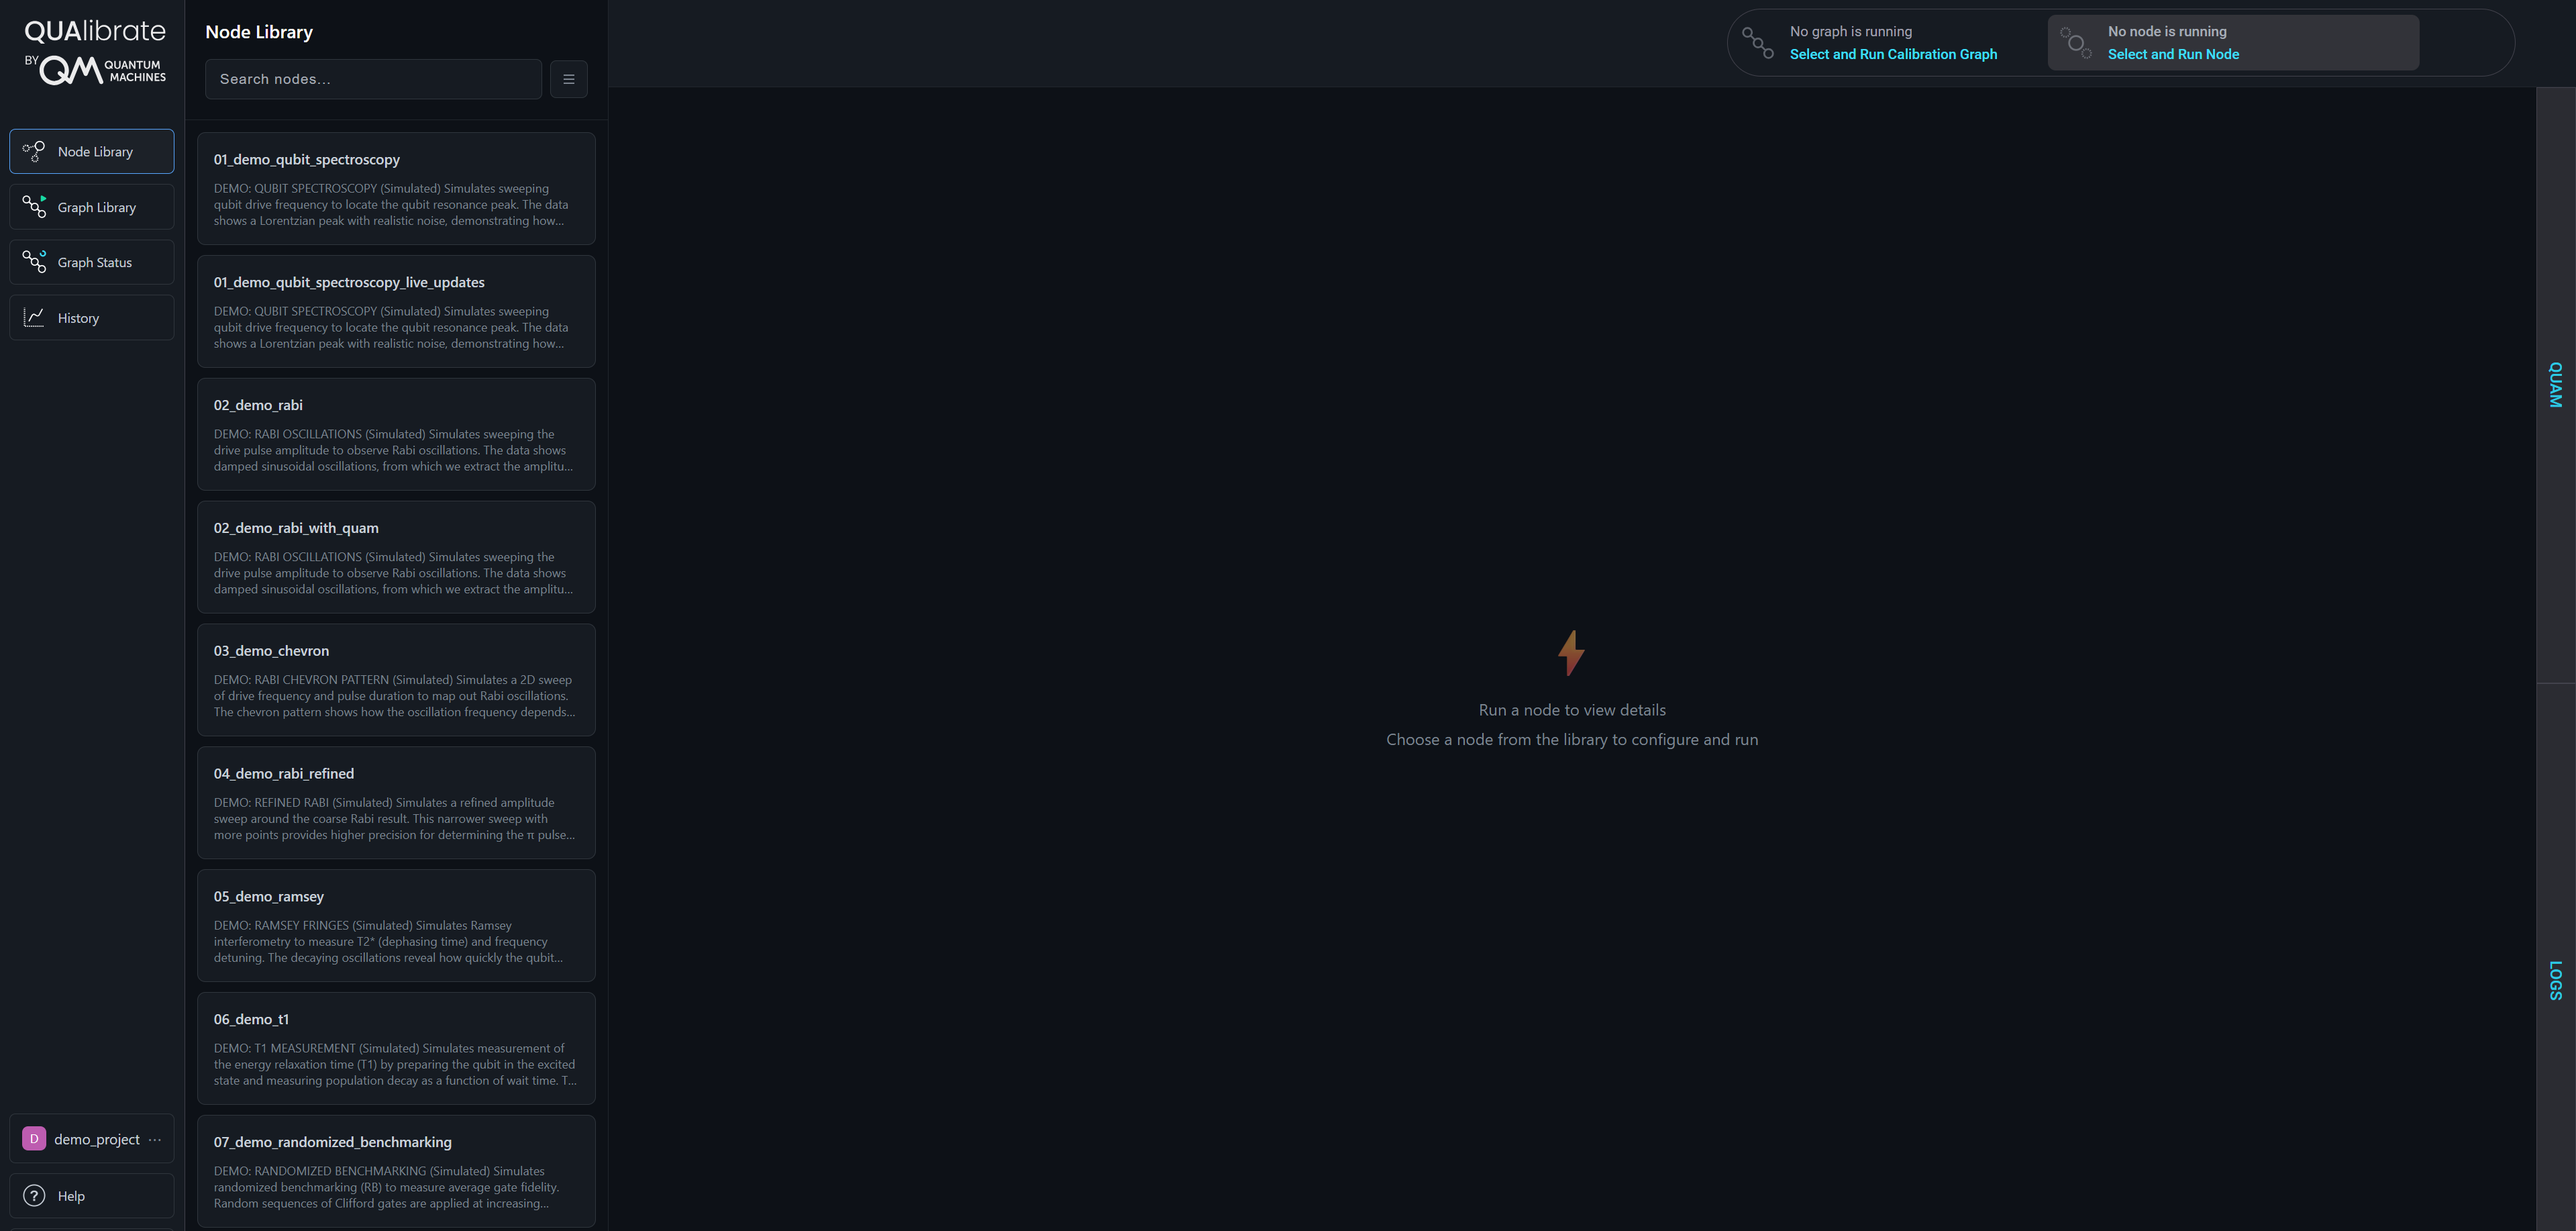
This webpage contains a list of all nodes registered in the qualibrate_runner.calibration_library_folder path in the configuration file.
If you don't see any nodes in here, it may be because no nodes have yet been added to this folder.
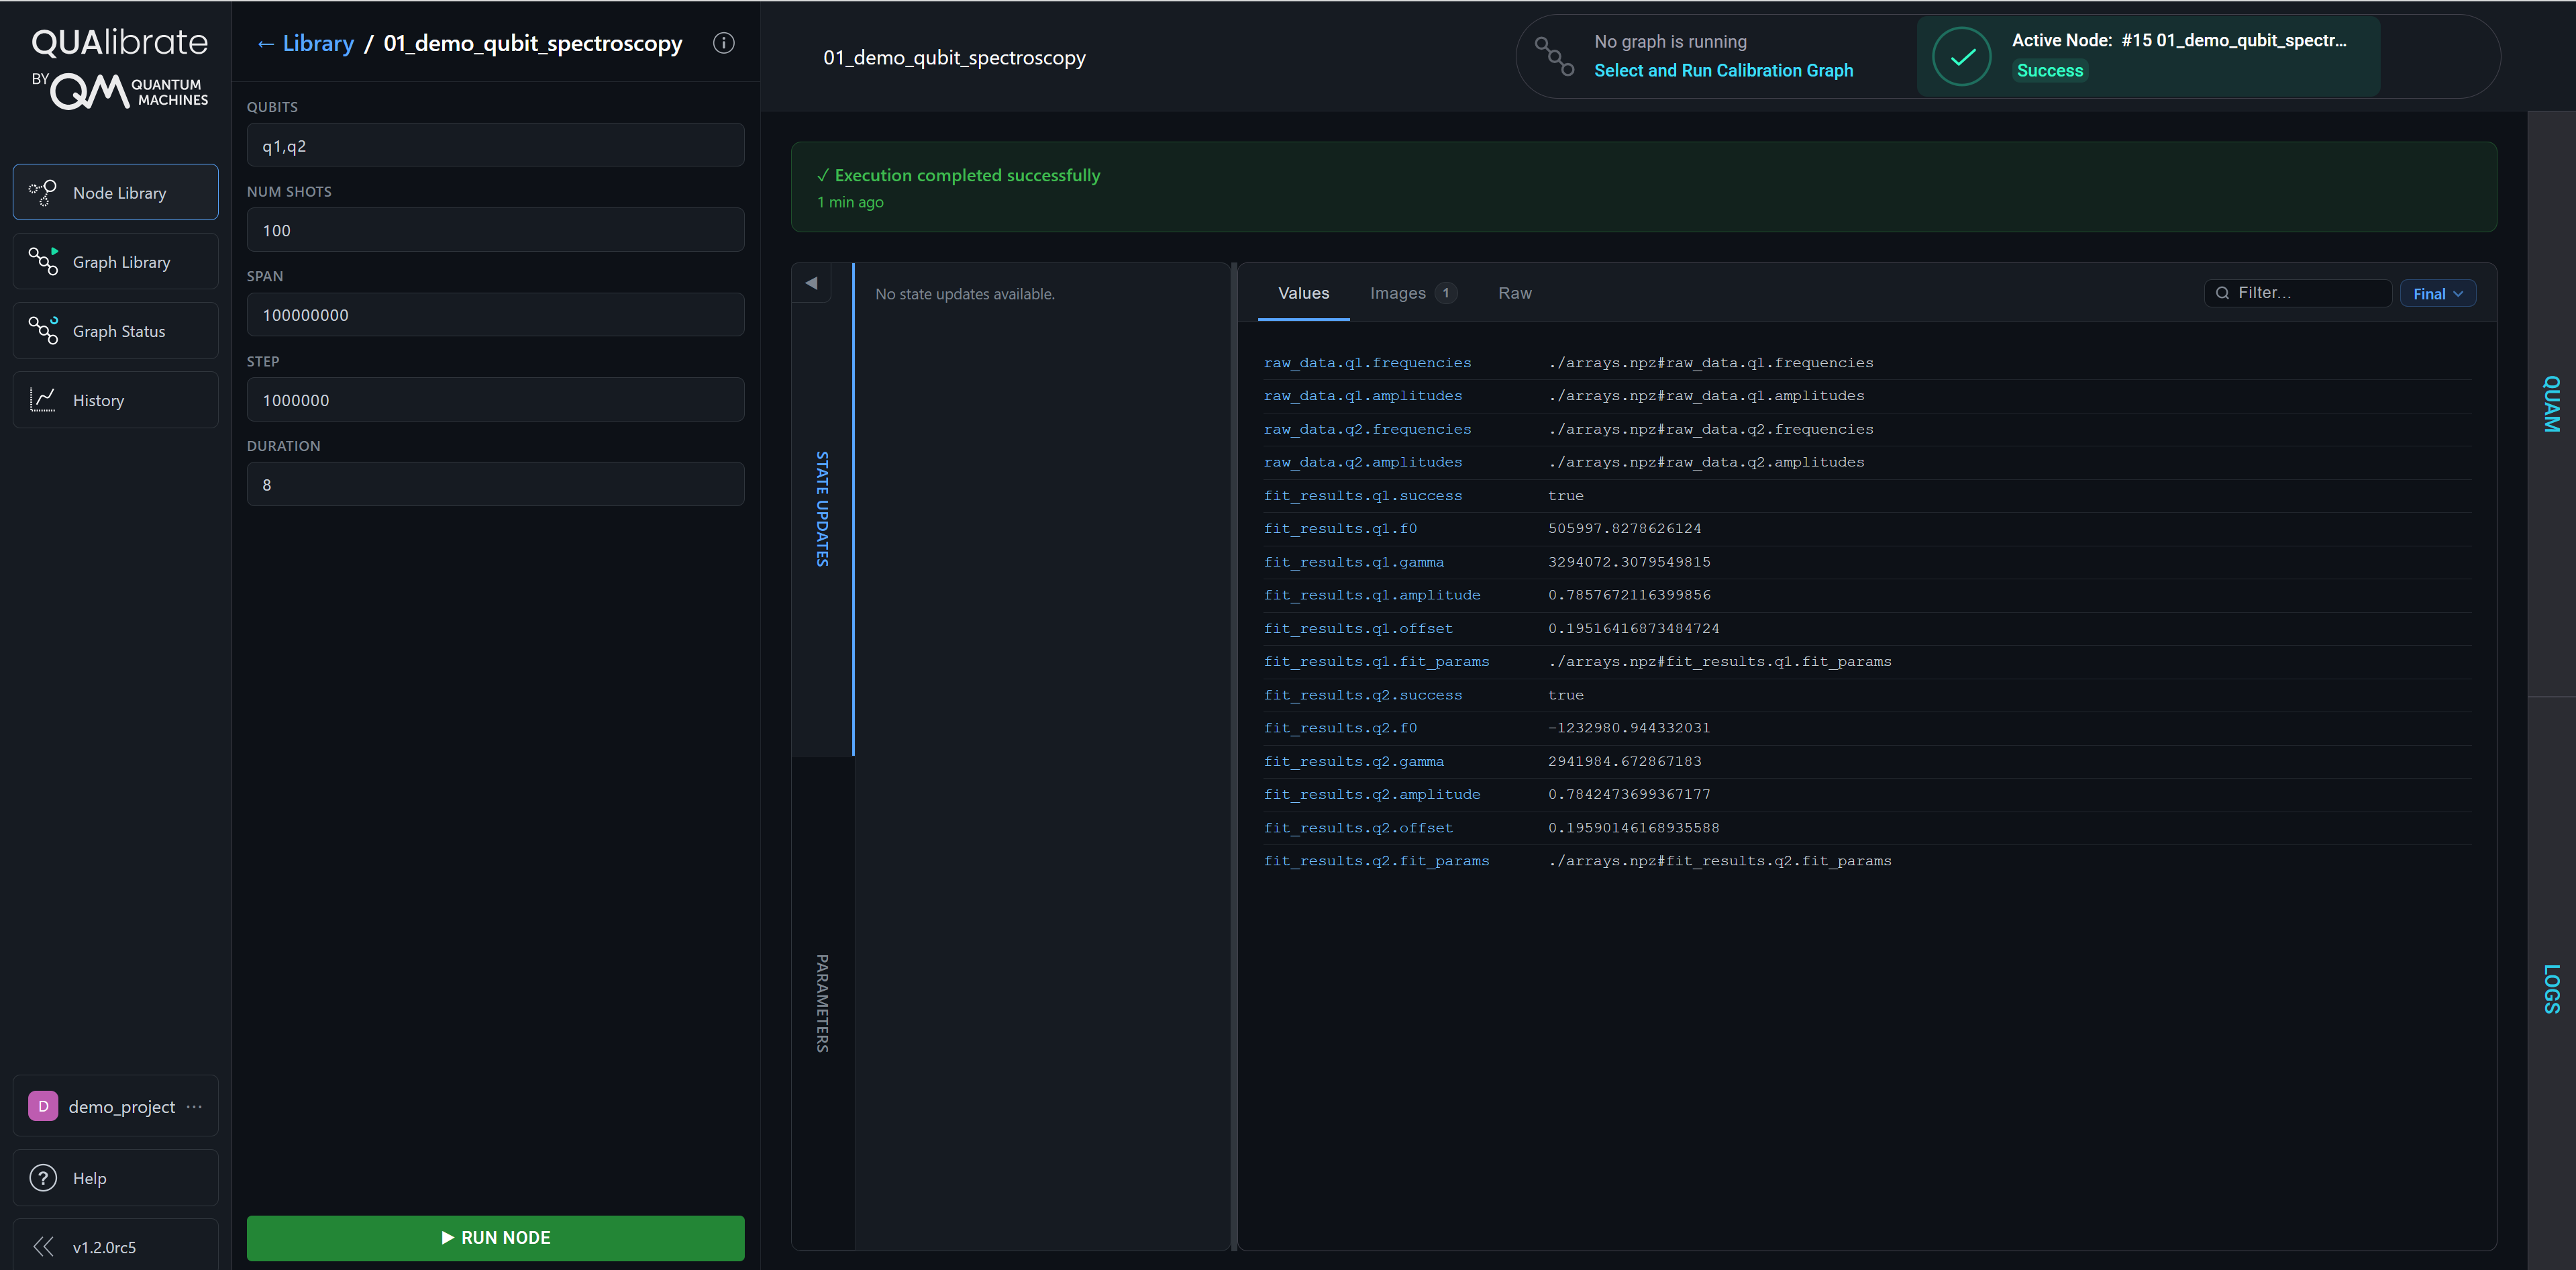
When selecting a node, the NodeParameters defined in the QualibrationNode file are displayed along with their default values.
These default values can be overwritten, and the node can then be executed by pressing the Run button.
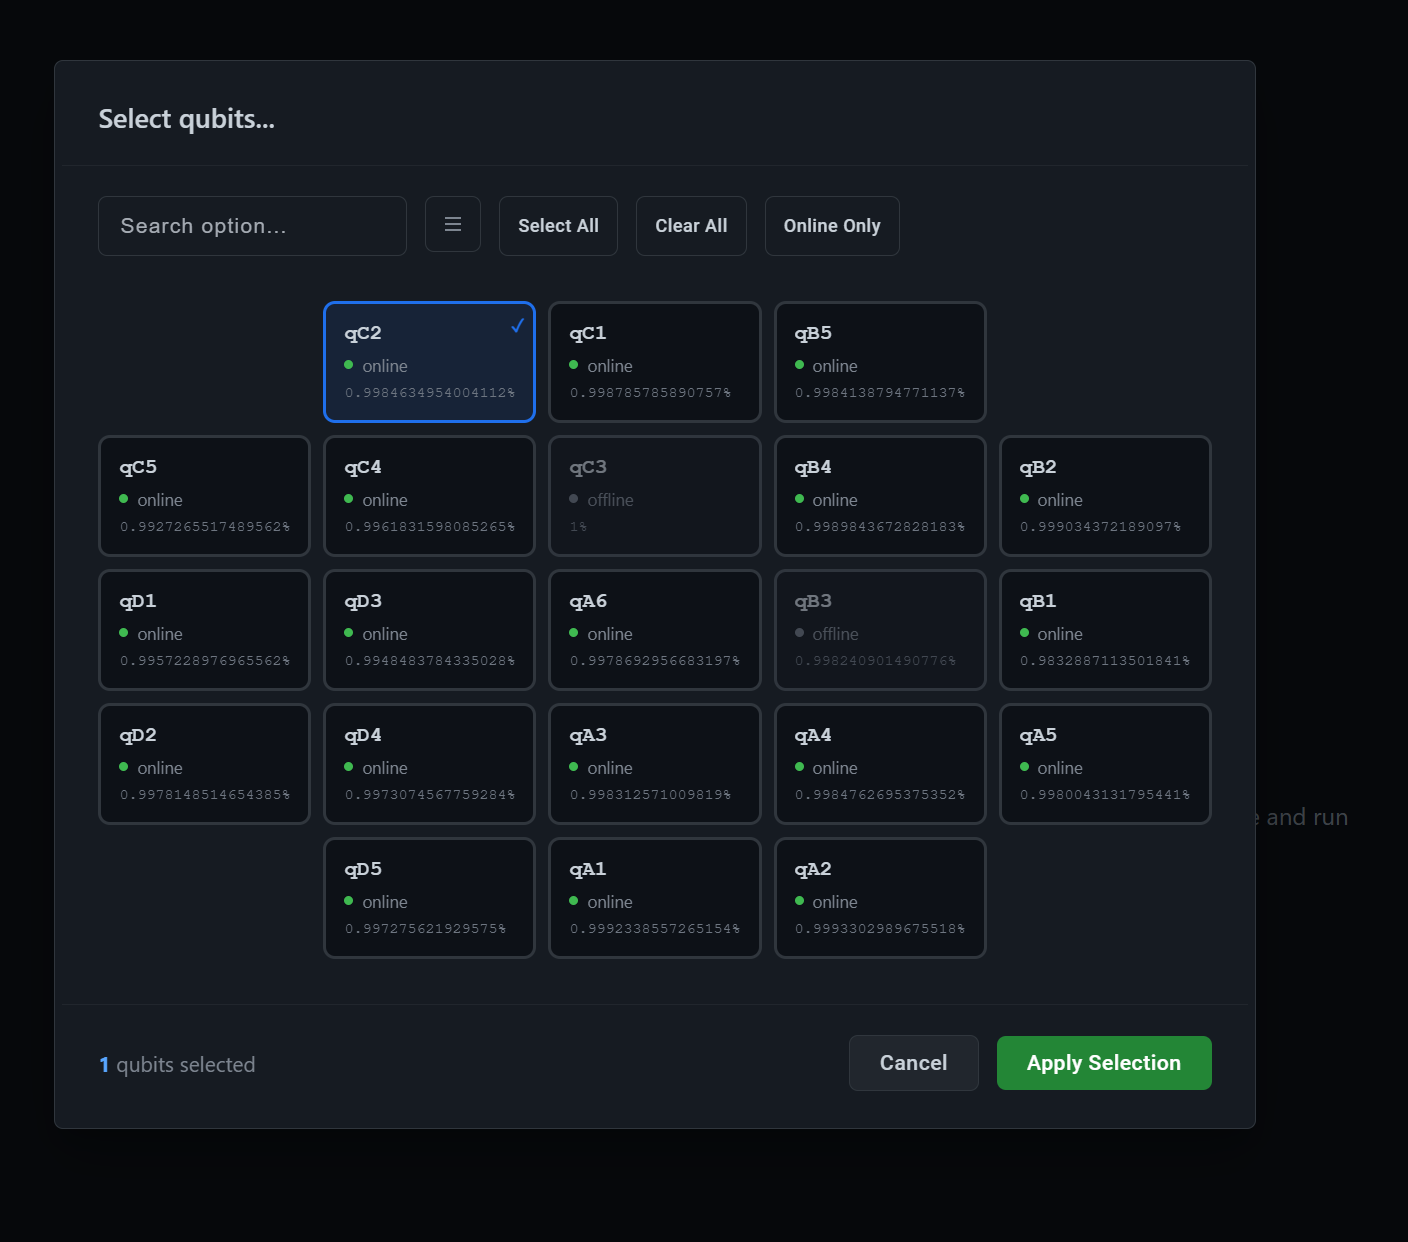
When a node is integrated with QUAM (i.e. it loads a Quam machine in the constructor), the parameters panel also includes a qubit selector. The selector lists every qubit available in the loaded QUAM state along with its online status and fidelity, and lets you choose which qubits the node should run on.
After the node execution has finished, the results are shown on the right-hand side.
 Result images are shown in an Images Gallery tab. Click any image to open it in a full-screen view with zoom and prev/next navigation between images.
Additionally, State updates may be shown if QUAM entries have been updated using with node.record_state_updates(): (see calibration nodes for details).
Graph library Page
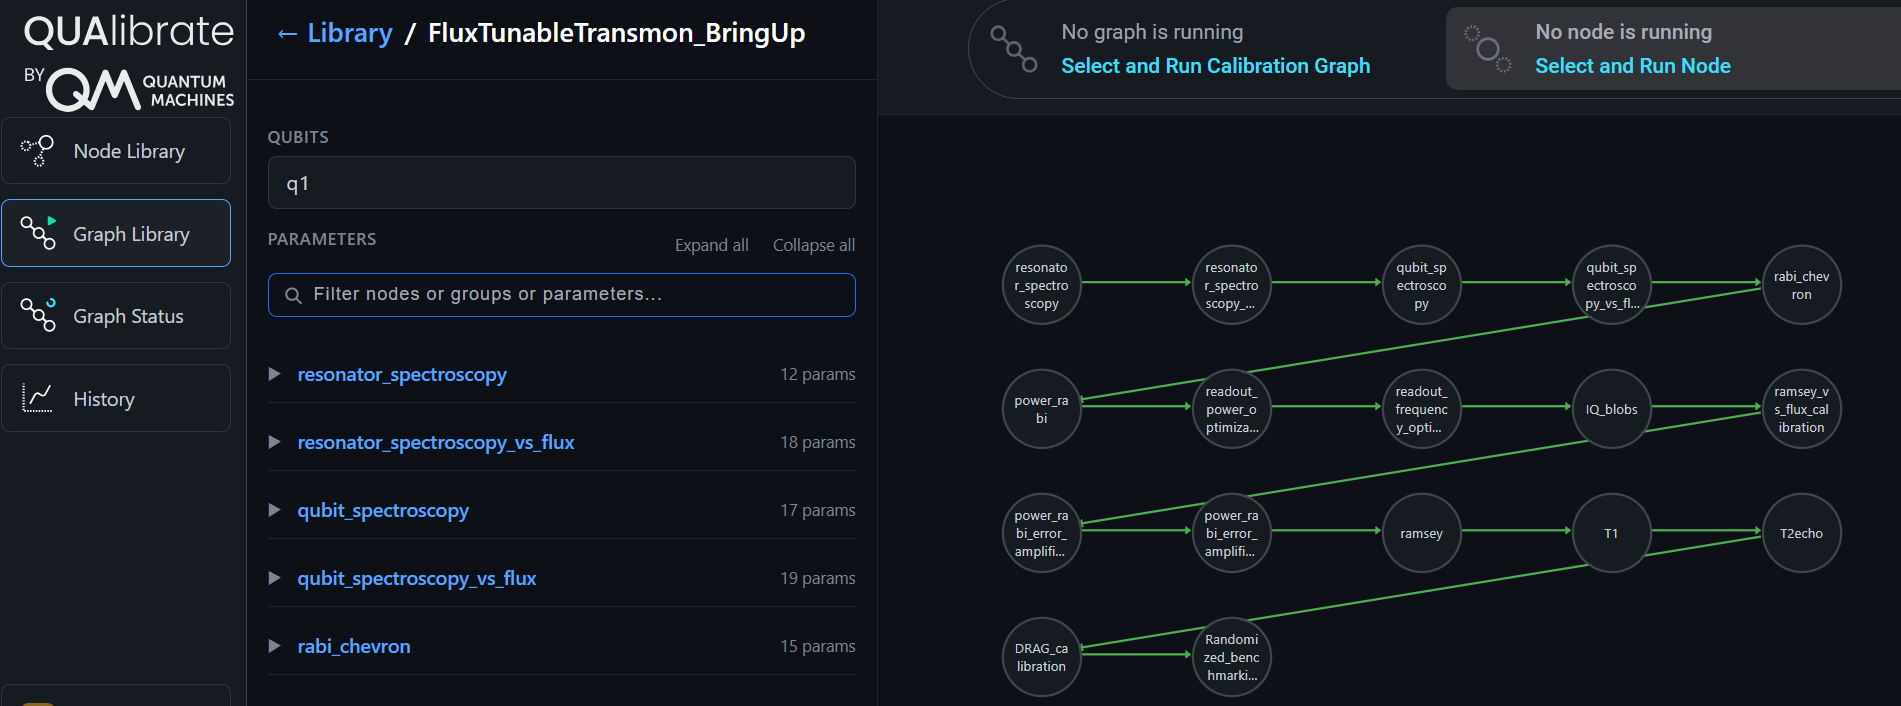
The Web App also supports running calibration graphs through the Graph Library page.
Any QualibrationGraph stored in the calibration library folder is displayed here and can be run with custom parameters.
For example, the user can specify the targets (qubits) that the graph should be applied to.
Additionally, node-specific parameters can also be modified.
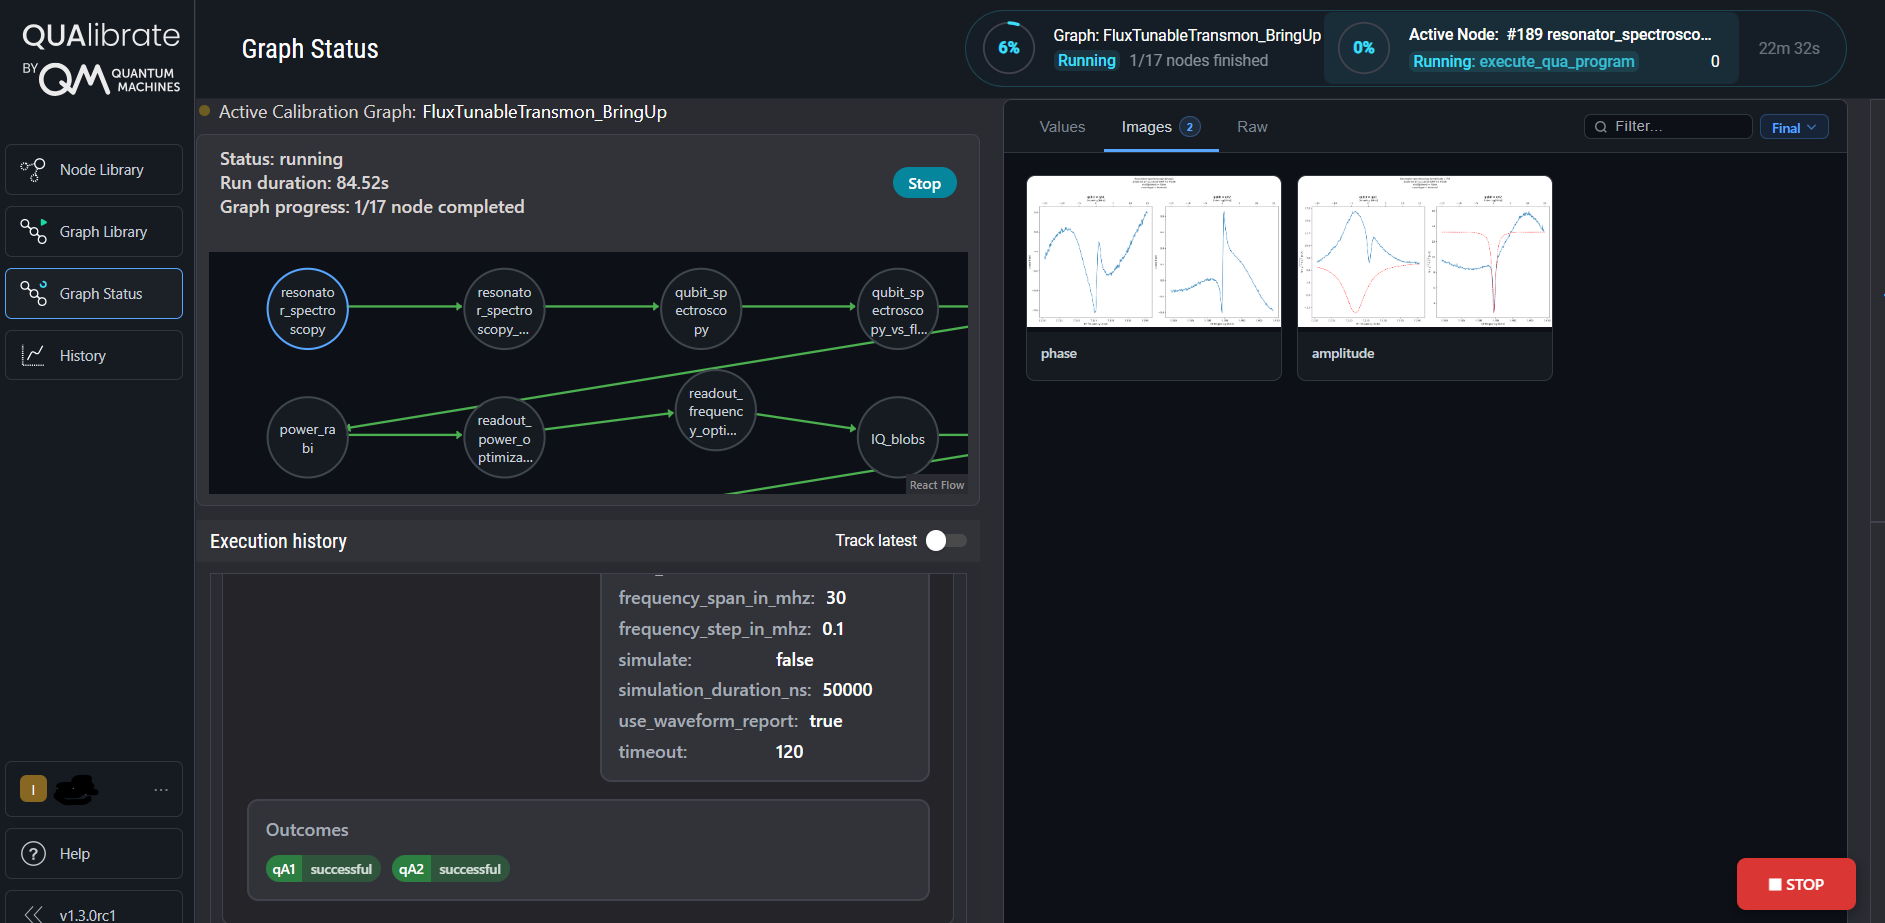
Graph Status Page
Once a job to run a graph has been dispatched, you will be redirected to the Graph Status page.
Here you can see the progress of the graph execution, including the results of executed nodes.
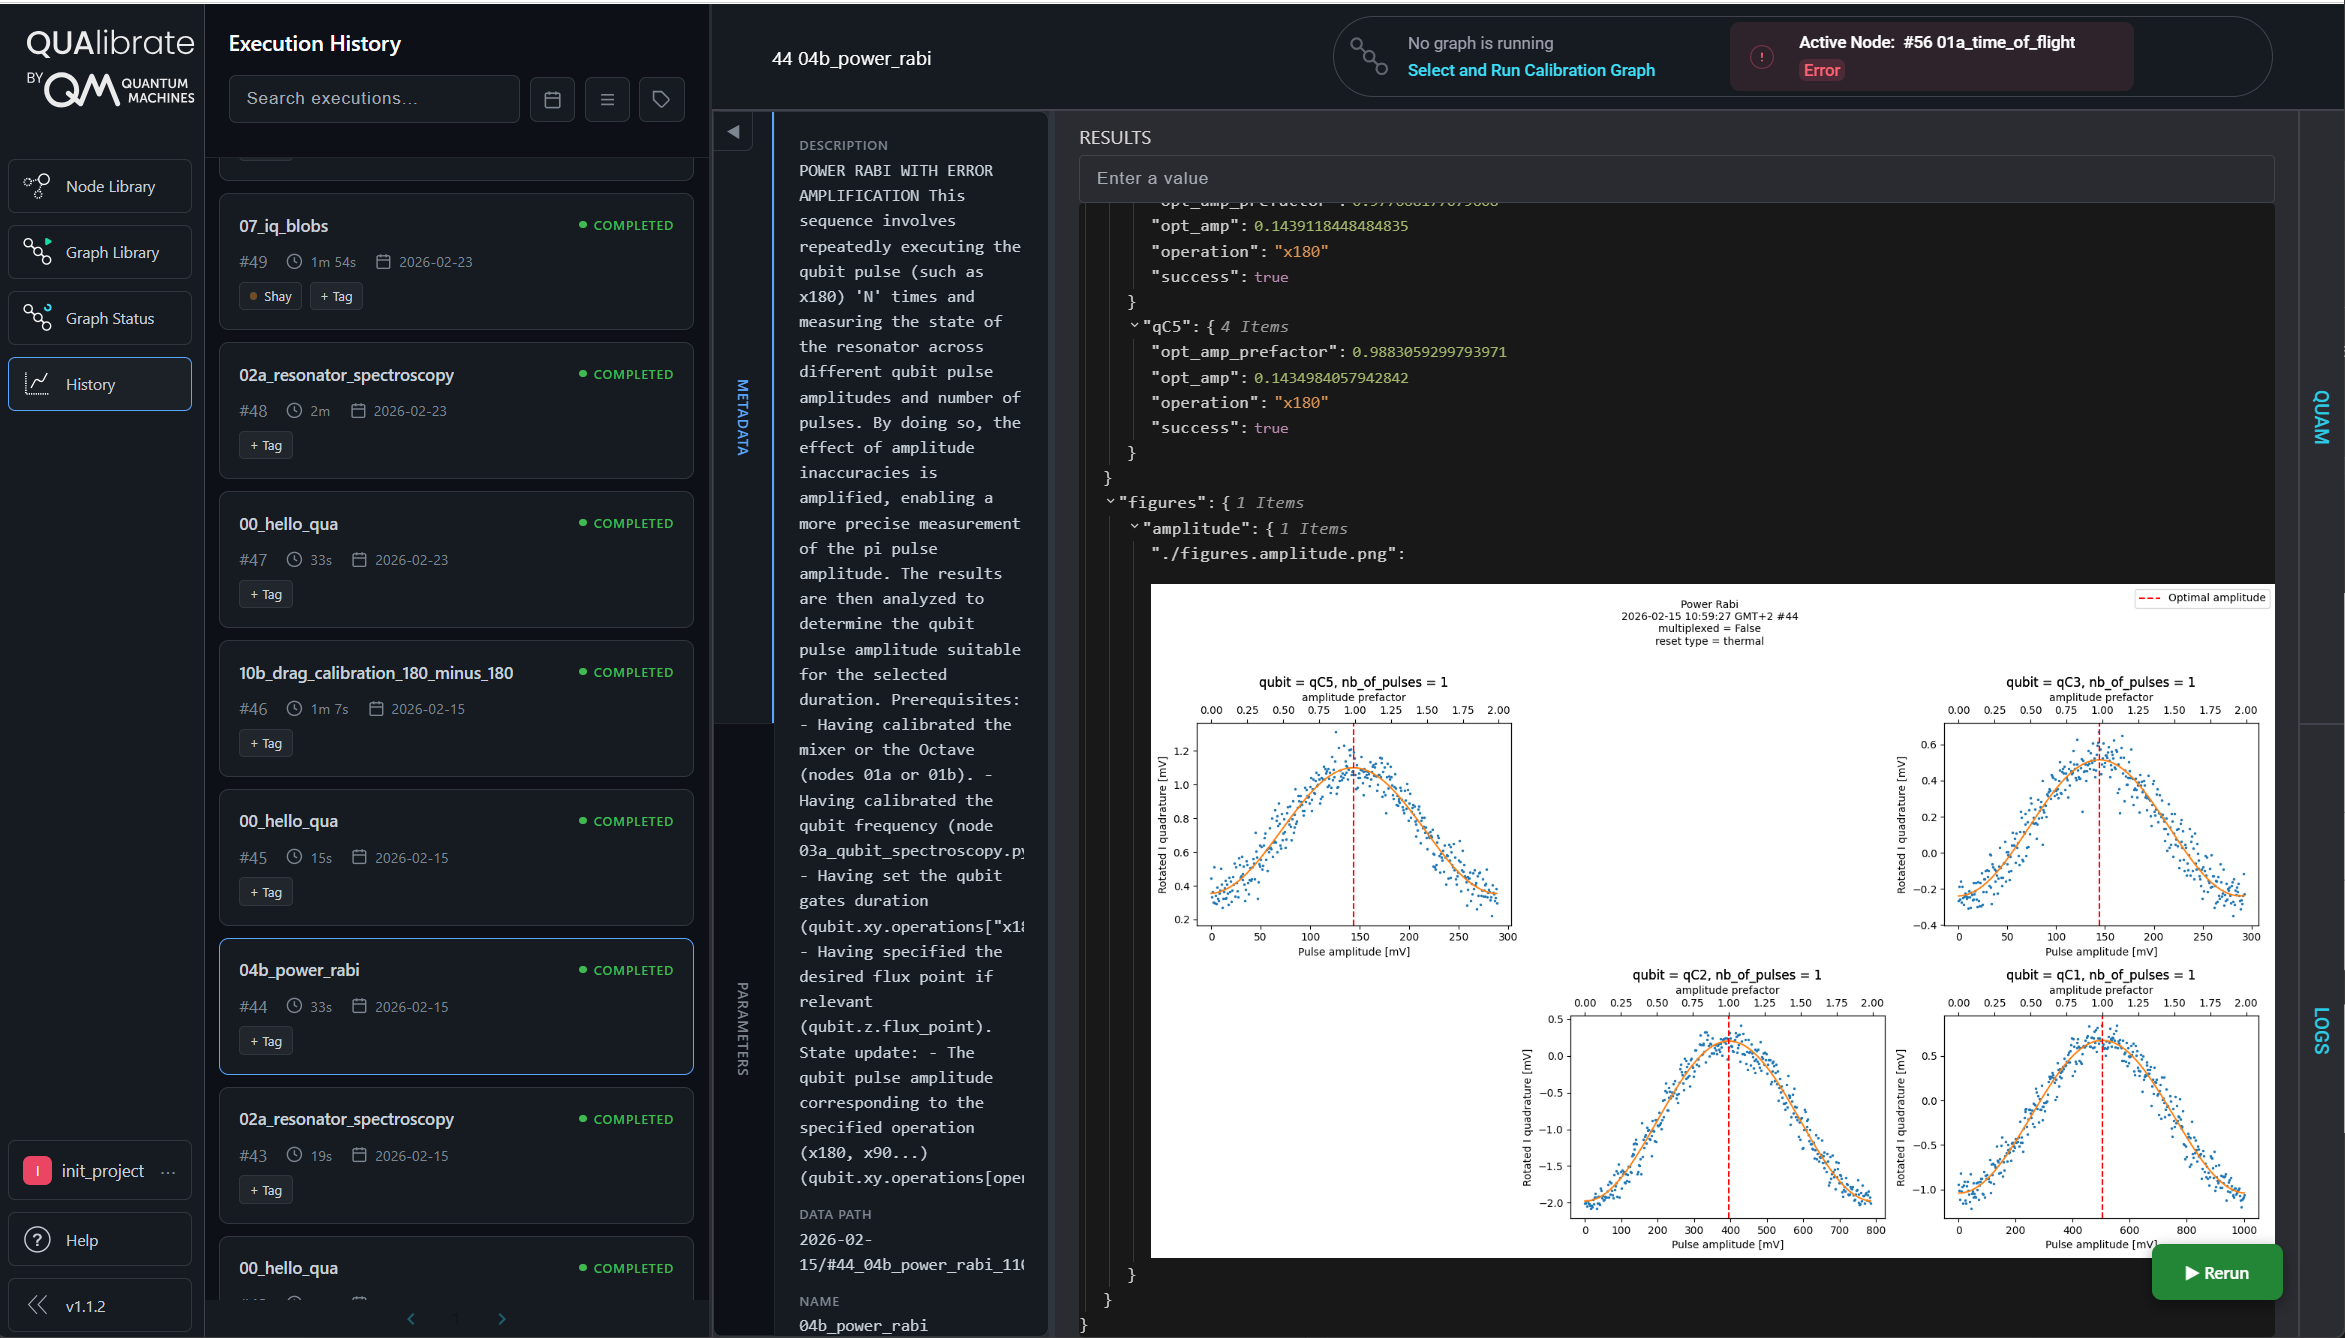
History Page
The History page displays the results of every executed node.
It lets you search past executions, filter and sort them, and mark favorite runs.
Records can be sorted by date or by type (Node / Graph).
Each record includes the node’s results, the QUAM state, and any changes made to QUAM during that execution.
For graph runs, the History view highlights the execution path taken by each qubit through the graph.
Interactive updates
While an experiment is running, it is possible to update the UI live — before the final results are received.
- Track execution progress
Set node.fraction_complete to a value between 0 and 1 to push the node's progress to the UI. Values outside the range are clamped.
for i in range(num_points):
    # ... measurement step ...
    node.fraction_complete = (i + 1) / num_points
- Log messages to the UI
Use node.log(message, level="info") to record log lines that appear both in the local log file and live in the QUAlibrate UI. Supported levels are the standard Python logging levels: "debug", "info", "warning", "error", "critical".
for i in range(num_points):
    if i % 10 == 0:
        node.log(f"Progress: {i}/{num_points} points")
    # ... measurement step ...
- Stream live measurements
Push intermediate results to the Live tab in Qualibrate using the DataDashboardClient:
# import data_dashboard https://github.com/qua-platform/qua-dashboards
from qua_dashboards.data_dashboard import DataDashboardClient
data_dashboard = DataDashboardClient()

# Send updates at any point during execution
spectroscopy_da = xr.DataArray( ... )
data_dashboard.send_data({"spectroscopy": spectroscopy_da})